EDA
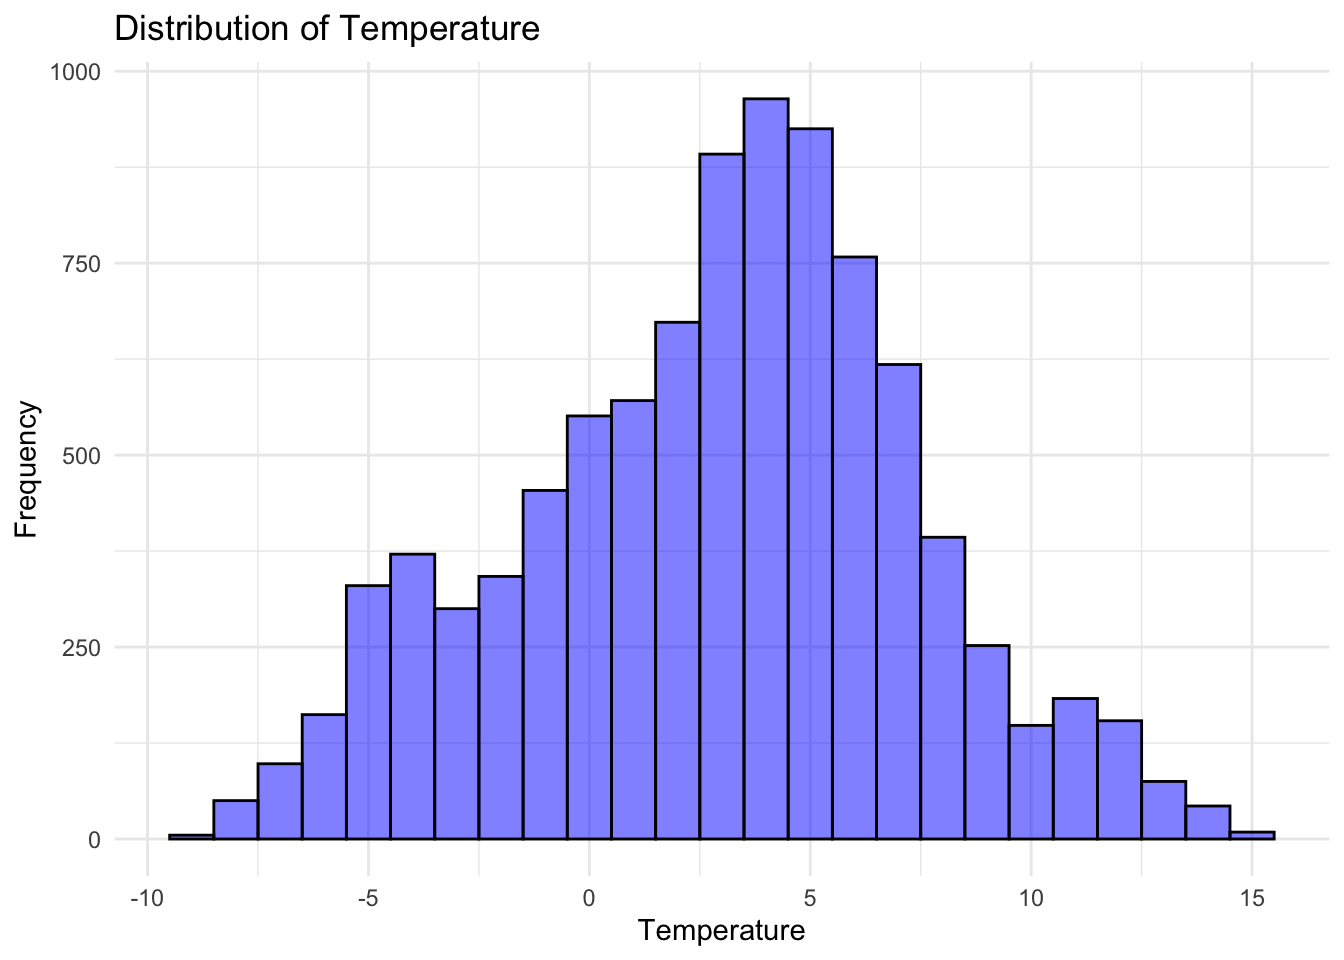
This histogram illustrates the distribution of temperature values in the dataset. It shows how frequently different temperature ranges occur, helping to understand the central tendency and spread of temperature measurements.
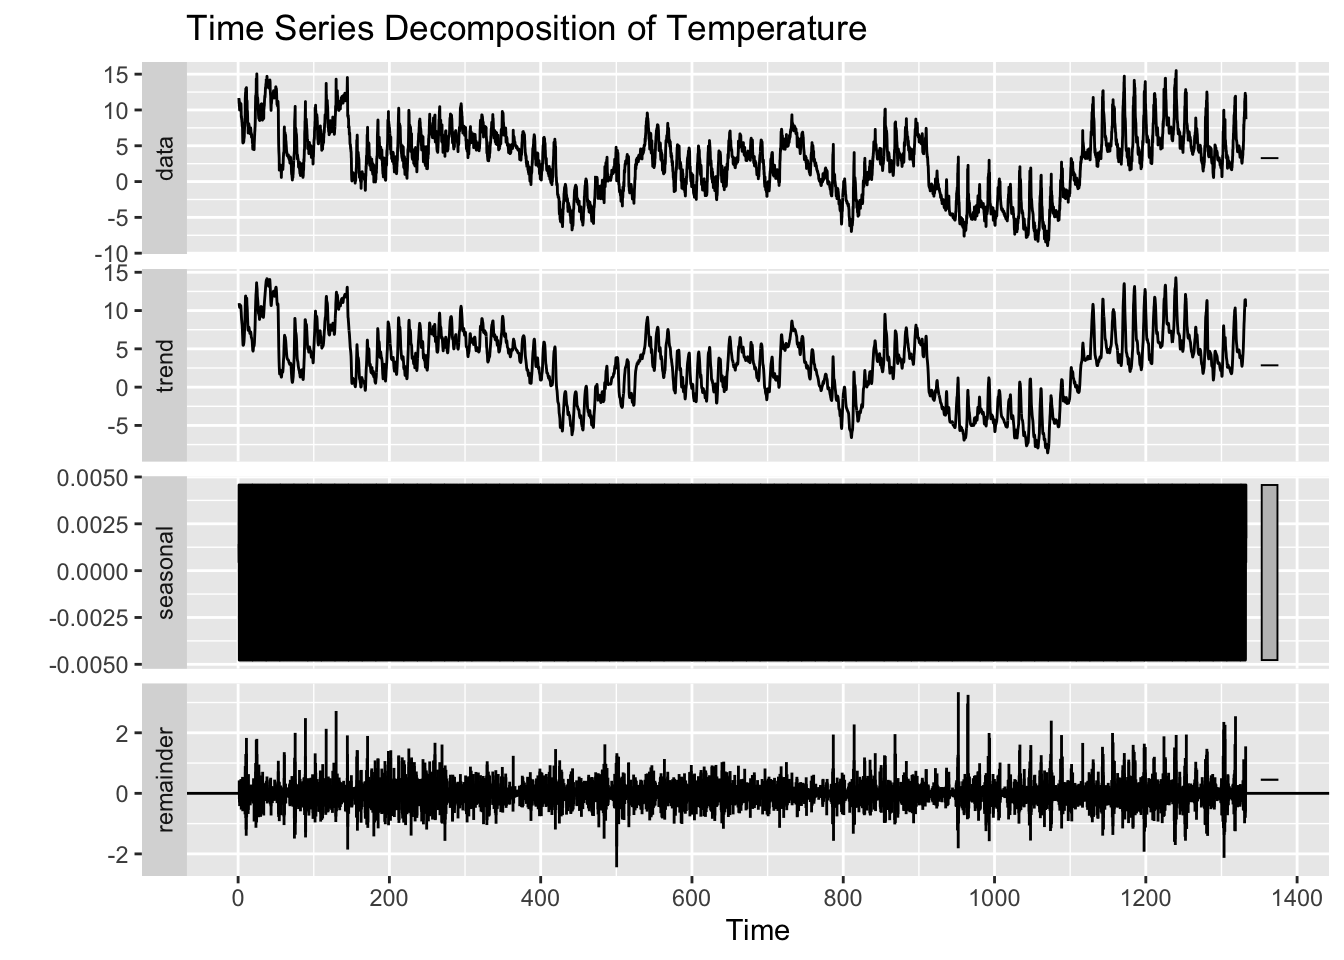
The decomposition plot breaks down the temperature data into its seasonal, trend, and residual components. This helps in identifying patterns over time, such as recurring seasonal variations or long-term trends in temperature changes.
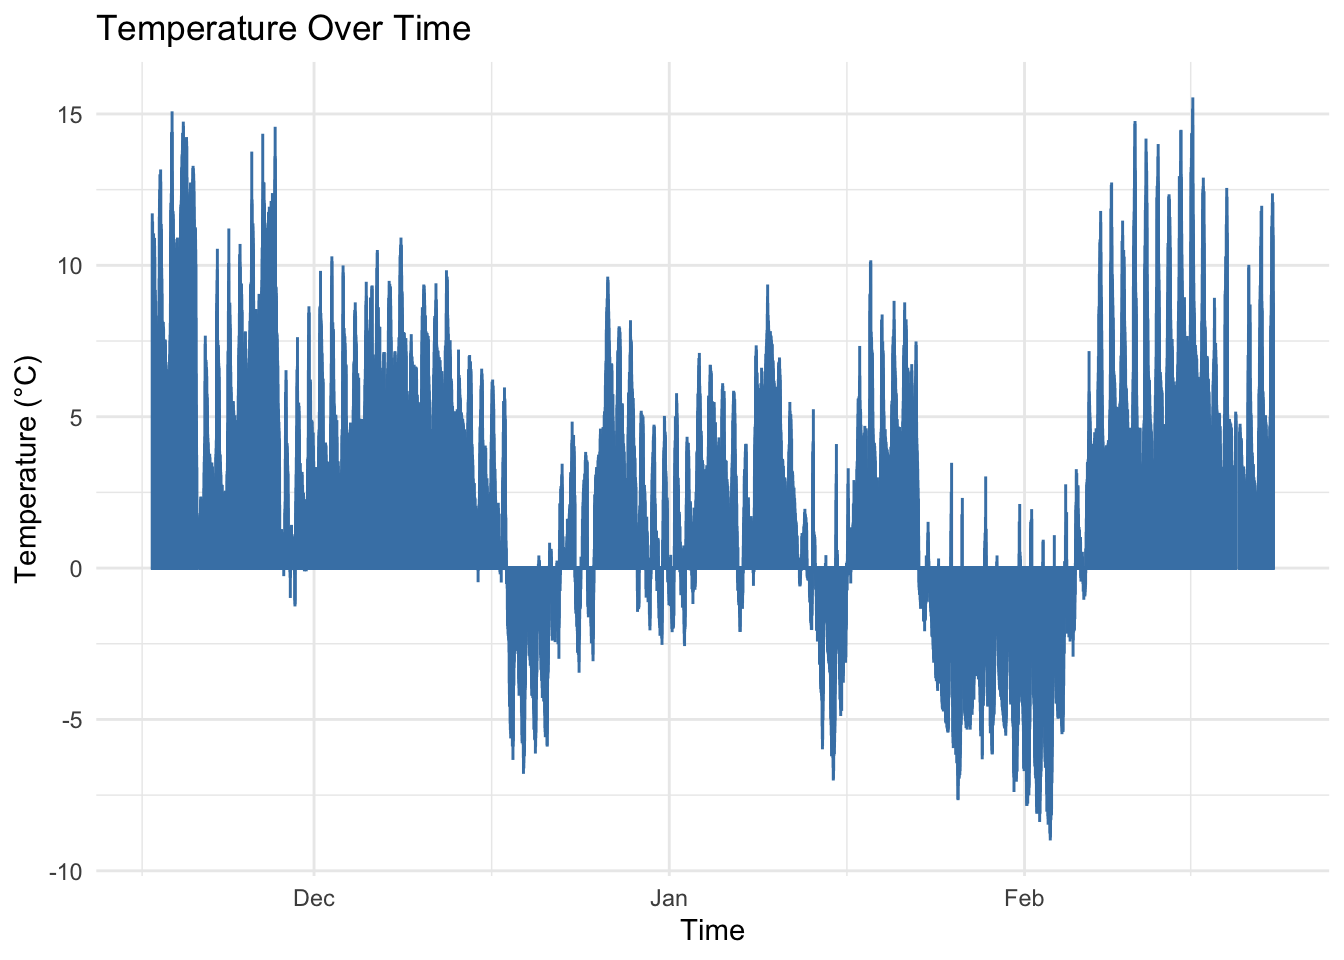
This bar plot visualizes how temperature varies over time, using timestamps (time) and corresponding temperature values. Each bar represents a specific time period, providing a clear overview of how temperatures fluctuate across different time points.